
Help
Loading and viewing data
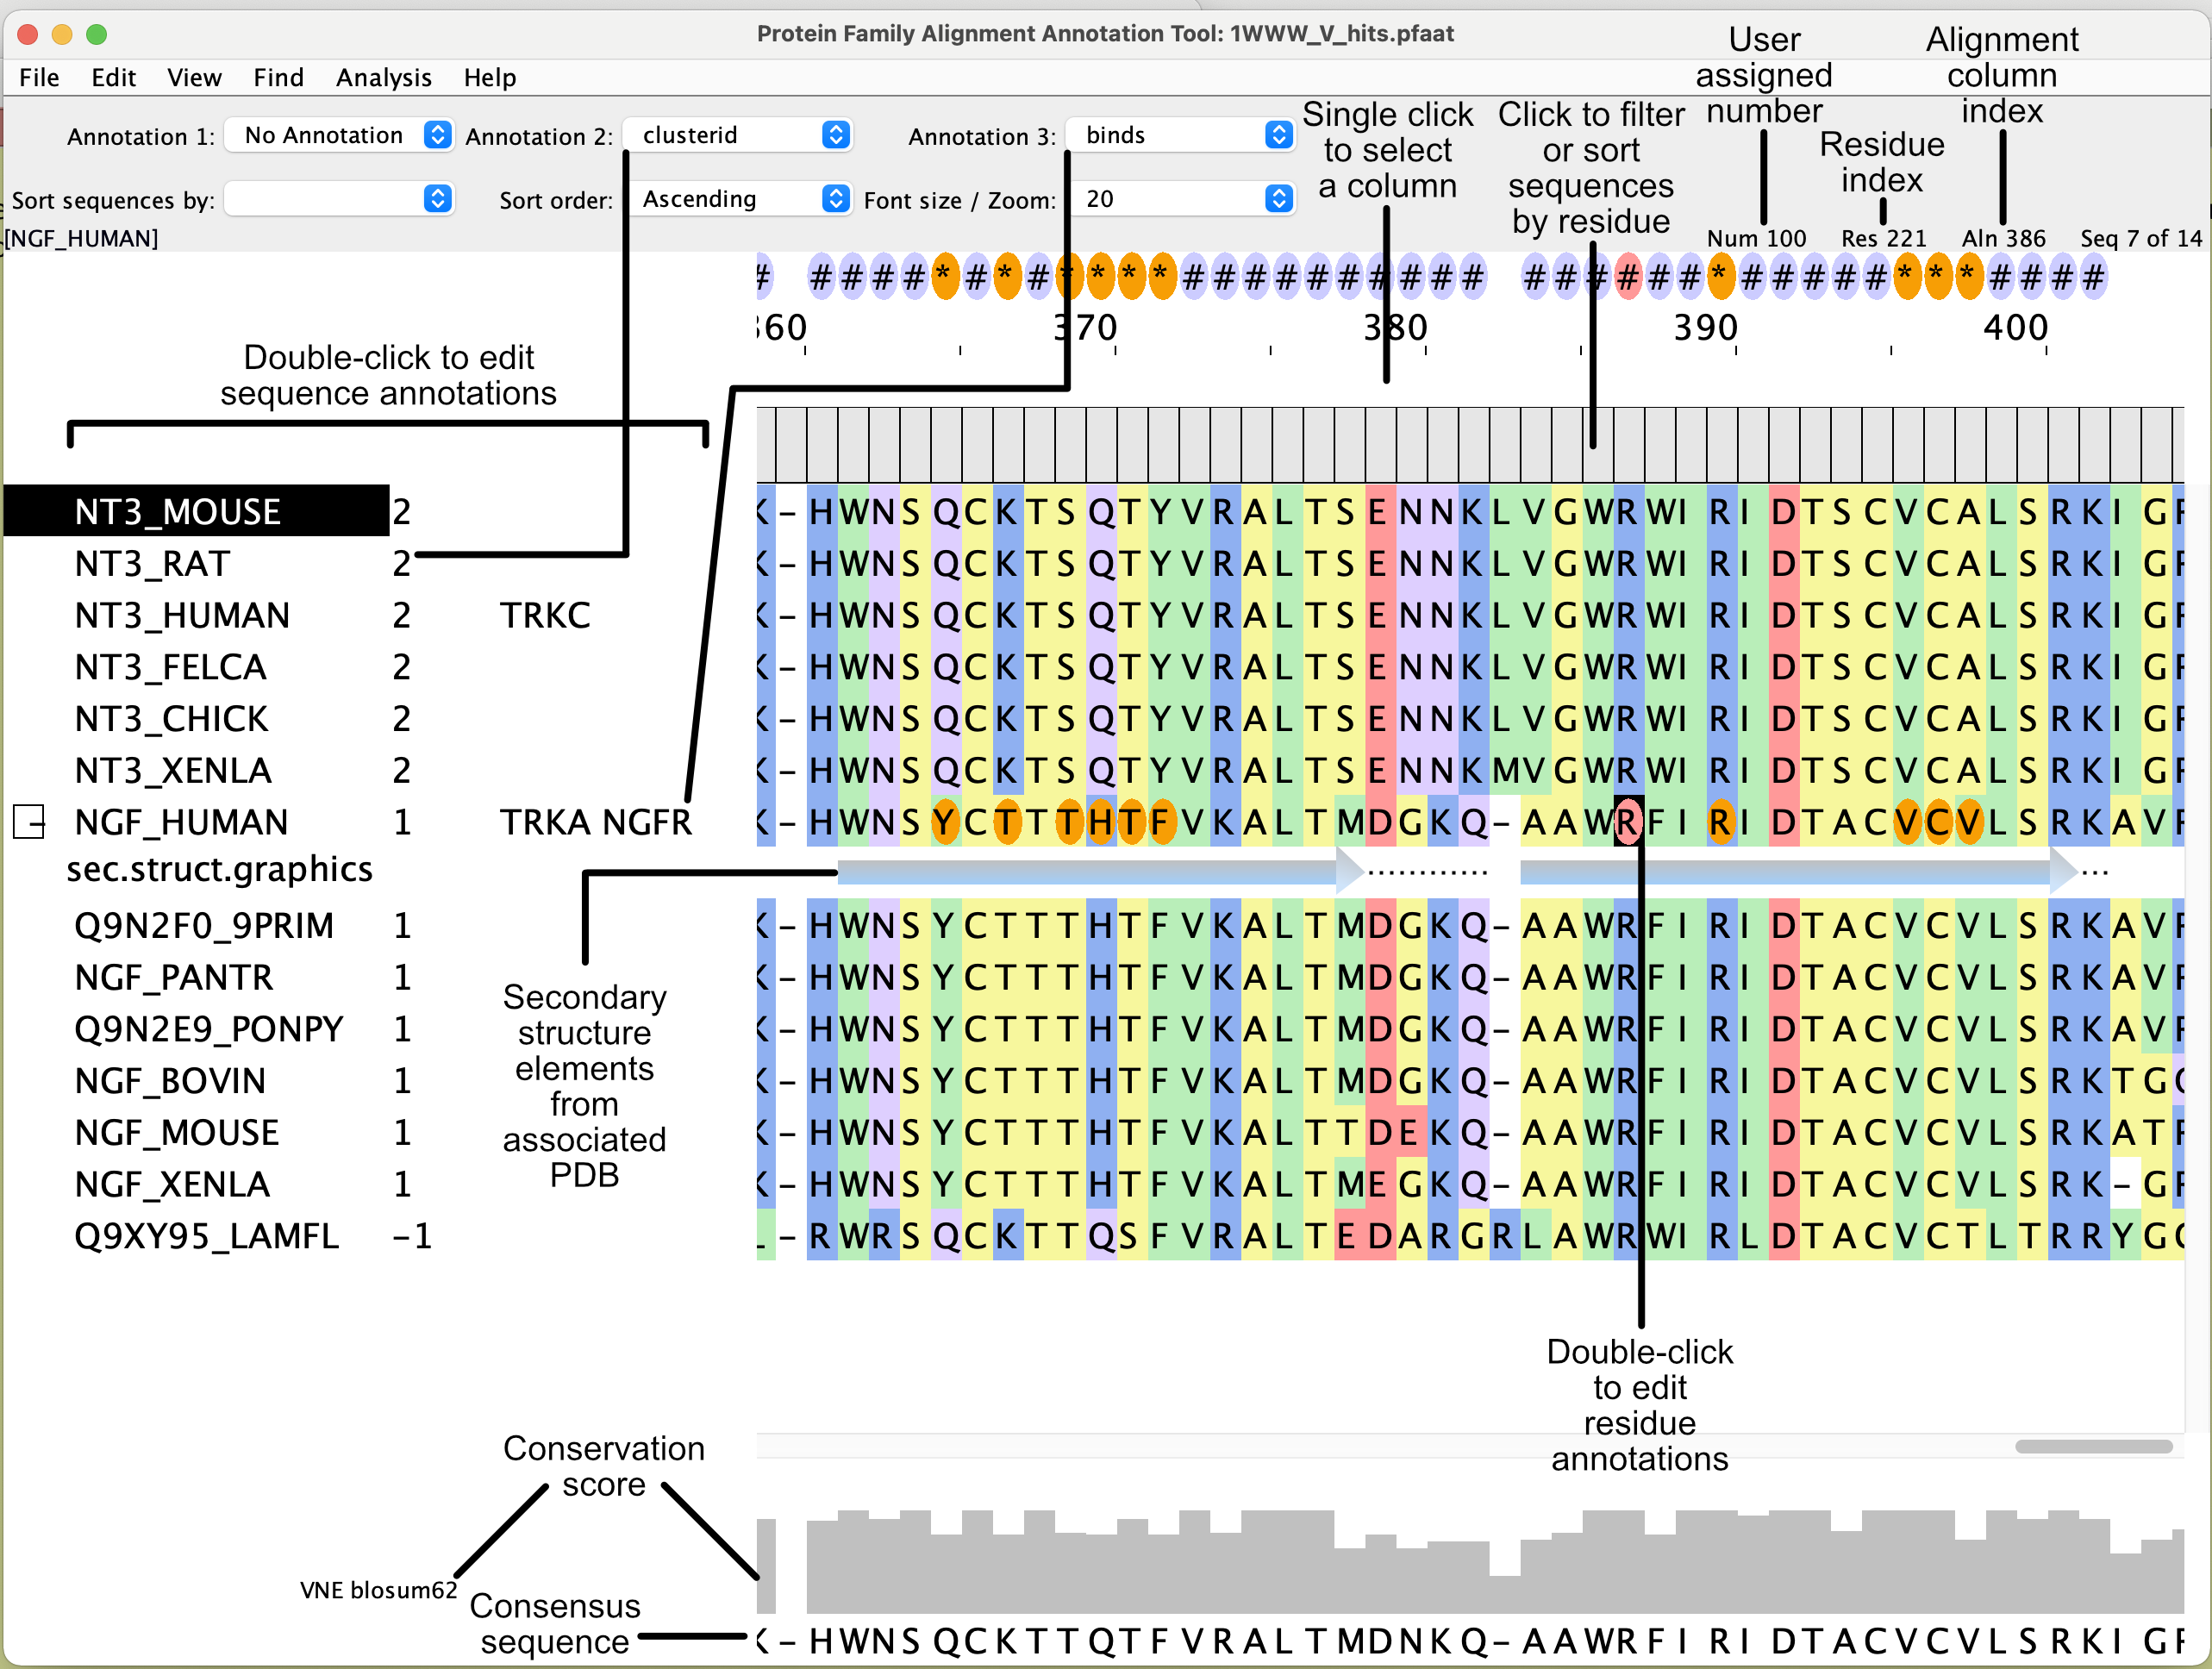
Download the example input files from the panel on the left and unzip them. The input folder contains an annotated multiple sequence alignment (1WWW_V_hits.pfaat) that can be opened with Pfaat (File->Open -> Alignment..). Next, you can open and view one of the phylogenetic trees (File-> Open -> Tree.. and choose 1WWW_V_NJ.nhx or 1WWW_V_MB.nhx). Next, you can right-click on the NGF_HUMAN sequence and View the Associated Structure (1WWW.pdb). Click File-> Import -> residue annotations and choose one of the .csv files in the residueAnnotations subfolder to load residue annotations. Click File-> Import -> Sequence annotations and choose 1WWW_V_hits_sequenceAnnotations.csv from the sequenceAnnotations subfolder to load sequence annotations.
Associating a structure prior to viewing it
You need to associate a PDB file with a sequence in the multiple sequence alignment prior to viewing the structure. The association step ensures that the residues in the sequence are associated with their corresponding residues in the structure. The residues in a pdb file are often numbered differently to the residues in a sequence. PFAAT will extract the PDB numbers and assign them to the User-assigned number(num) which is distinct from the Residue index (res) as shown in the screenshot above.
To associate a structure: Download a pdb file from rcsb.org . From the PFAAT window, click on File->Structure->Associate PDB numbering with Sequence , select the sequence in the alignment that is most similar to the structure (e.g. the sequence from a closely related species), select the PDB file to associate from the file chooser, select the appropriate chain ID (each chain ID is described on the RCSB web entry). PFAAT will create and insert a temporary alignment between the sequence extracted from the PDB file and the sequence that you are associating it with. A dialog will help you identify and view any residue differences between the PDB sequence and the sequence that you are associating it with. If parts of the temporary alignment look wrong, you can use the space bar and delete key to make corrections. It is important to check the temporary alignment to ensure the correct residue associations are made. Click the 'approve and view' button on the dialog to view the structure. The temporary alignment will be removed and the sequence in the multiple sequence alignment will contain the PDB numbers. Save the multiple sequence alignment in the .pfaat format so you can quickly view the associated pdb file next time (File->Structure->View Associated Structure...).
Coloring a structure by residue conservation
PFAAT can calculate and display a variety of residue conservation scores that are displayed as grey bars below each residue column (See the screenshot above and Analysis->Conservation scores->). You can 'map' the currently displayed conservation scores in the multiple sequence alignment to an associated structure (Analysis-> Color Structure By Residue Conservation Scores ...). The corresponding residues in the structural viewer will be colored according to the options specified in the dialog box.
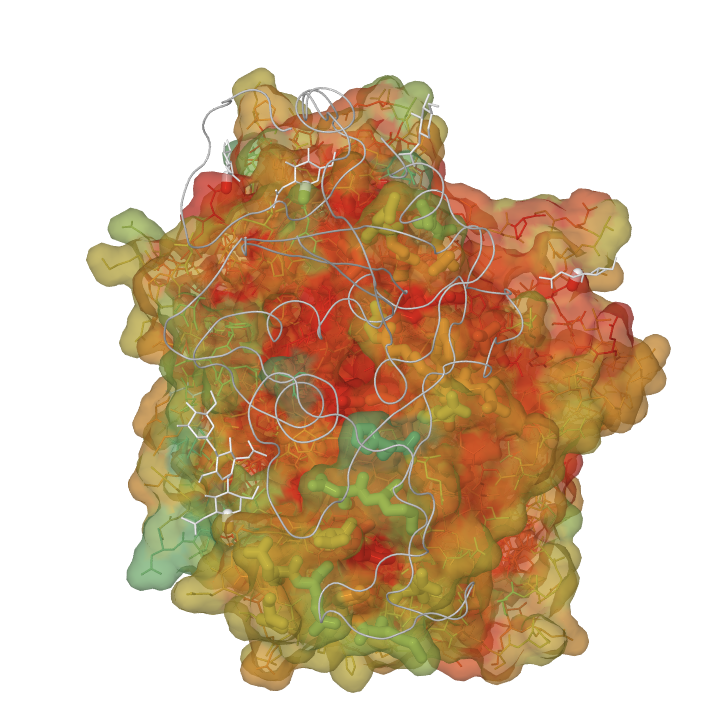
The image above shows ACE2 rendered as a molecular surface with residues colored by residue conservation. The gray trace corresponds to the spike protein from SARS-CoV. The spike protein is interacting with residues on ACE2 (rendered as thick sticks and often with low conservation scores). Residues that are identical across all sequences in the multiple alignment have a conservation score of 1 and are colored red. The conservation scores are derived from von Neumann entropy, such that identical residues will have a score of 1 and variable residues will approach 0 based on their degree of dissimilarity. Under the above coloring scheme, residues that are identical across all sequences(score=1) are colored red and the other conservation scores are binned as shown in the legend.
Coloring a structure by residue annotation
A residue annotation allows you to assign values to residues in the multiple sequence alignment. The values could be anything (e.g. be p-values or probabilities that you generated from a program that tests for positive selection) that were imported into PFAAT (File-> Import -> residue annotations ) or added manually.. Alternatively, they might be measures of surface accessibility (Analysis-> Compute Solvent accessibilities...) or contact surfaces with an interacting molecule (Analysis -> Compute delta Relative RSA at binding site...).
An associated structure can be colored according to these residue annotation values (Analysis -> Color Structure By residue annotation Values...). The corresponding residues in the structure will be colored according to the options specified in the dialog box.
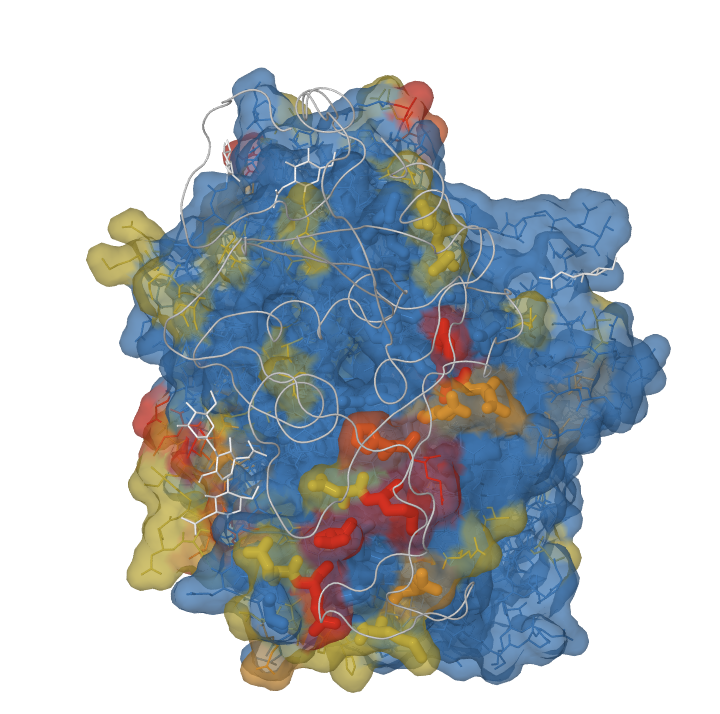

The image above shows ACE2 rendered as a molecular surface with residues colored by evidence for positive selection. The colors correspond to p-values for positive selection tests and were imported into PFAAT as residue annotations. The gray trace corresponds to the spike protein from SARS-CoV. The spike protein is interacting with residues on ACE2 (rendered as thick sticks and often under positive selection). The white sticks correspond to glycans that are N-linked to ACE2 residues.
References
PFAAT version 2.0: a tool for editing, annotating, and analyzing multiple sequence alignments. Caffrey DR, Dana PH, Mathur V, Ocano M, Hong EJ, Wang YE, Somaroo S, Caffrey BE, Potluri S, Huang ES. 2007 Oct 11;8:381 PDF
Prediction of specificity-determining residues for small-molecule kinase inhibitors. Caffrey DR, Lunney EA, Moshinsky DJ. 2008 Nov 25;9:491 PDF